Welcome to Analytics-Data-Where-House Docs!
Table of Contents
Platform Overview
This platform automates curating a local data warehouse of interesting, up-to-date public data sets. It enables users (well, mainly one user, me) to easily add data sets to the warehouse, build analyses that explore and answer questions with current data, and discover existing assets to accelerate exploring new questions.
At present, it uses docker to provision and run:
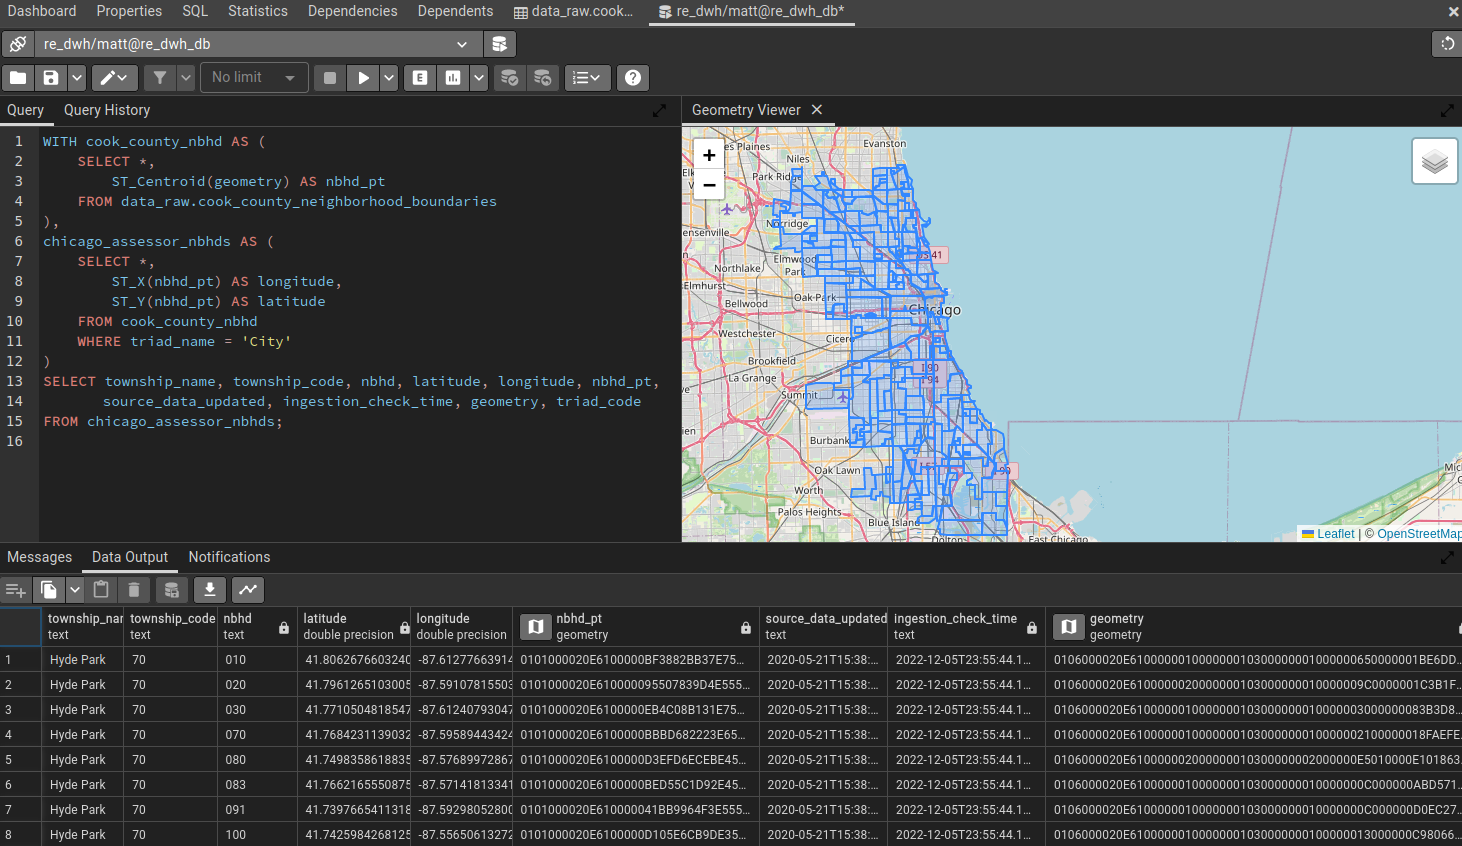
- a PostgreSQL + PostGIS database as the data warehouse,
-
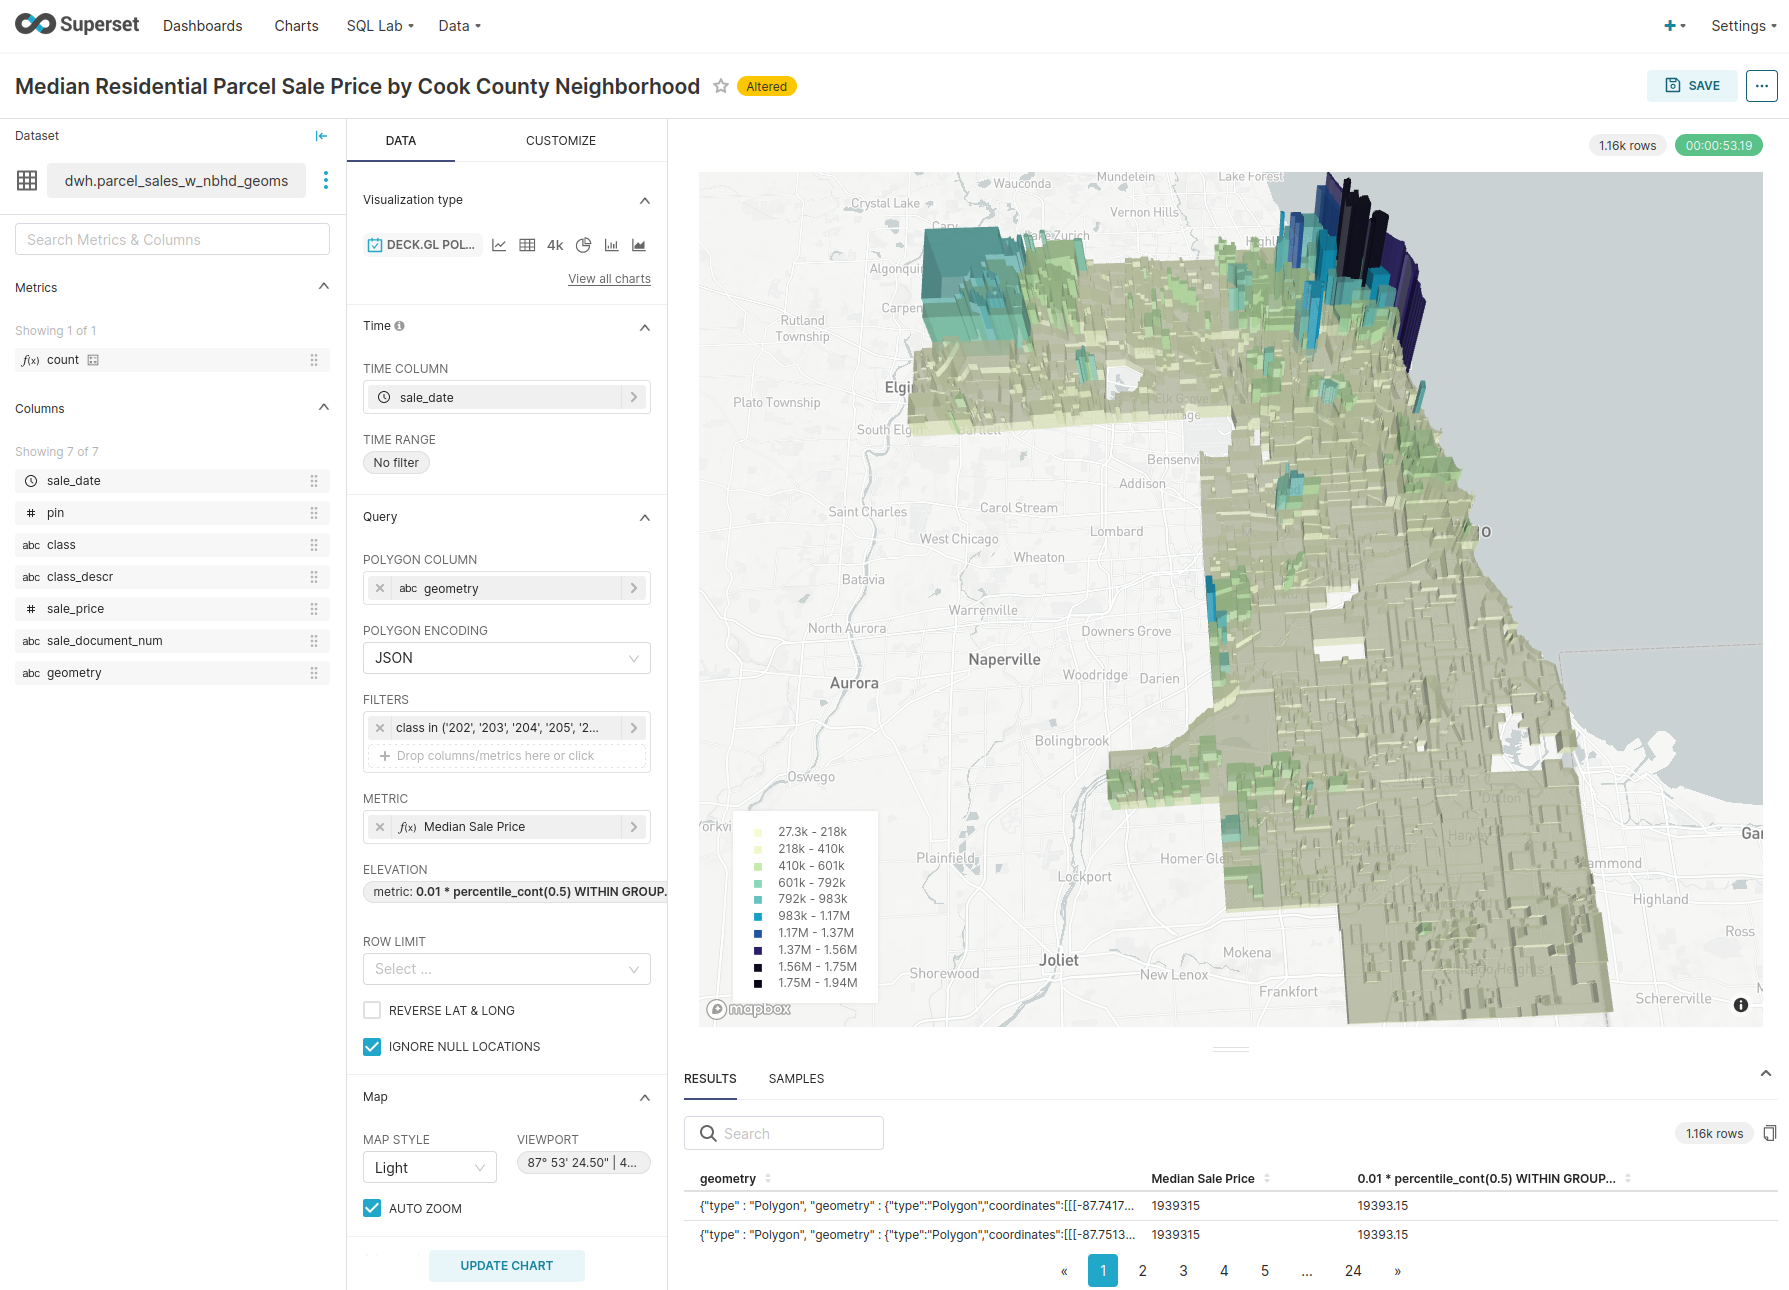
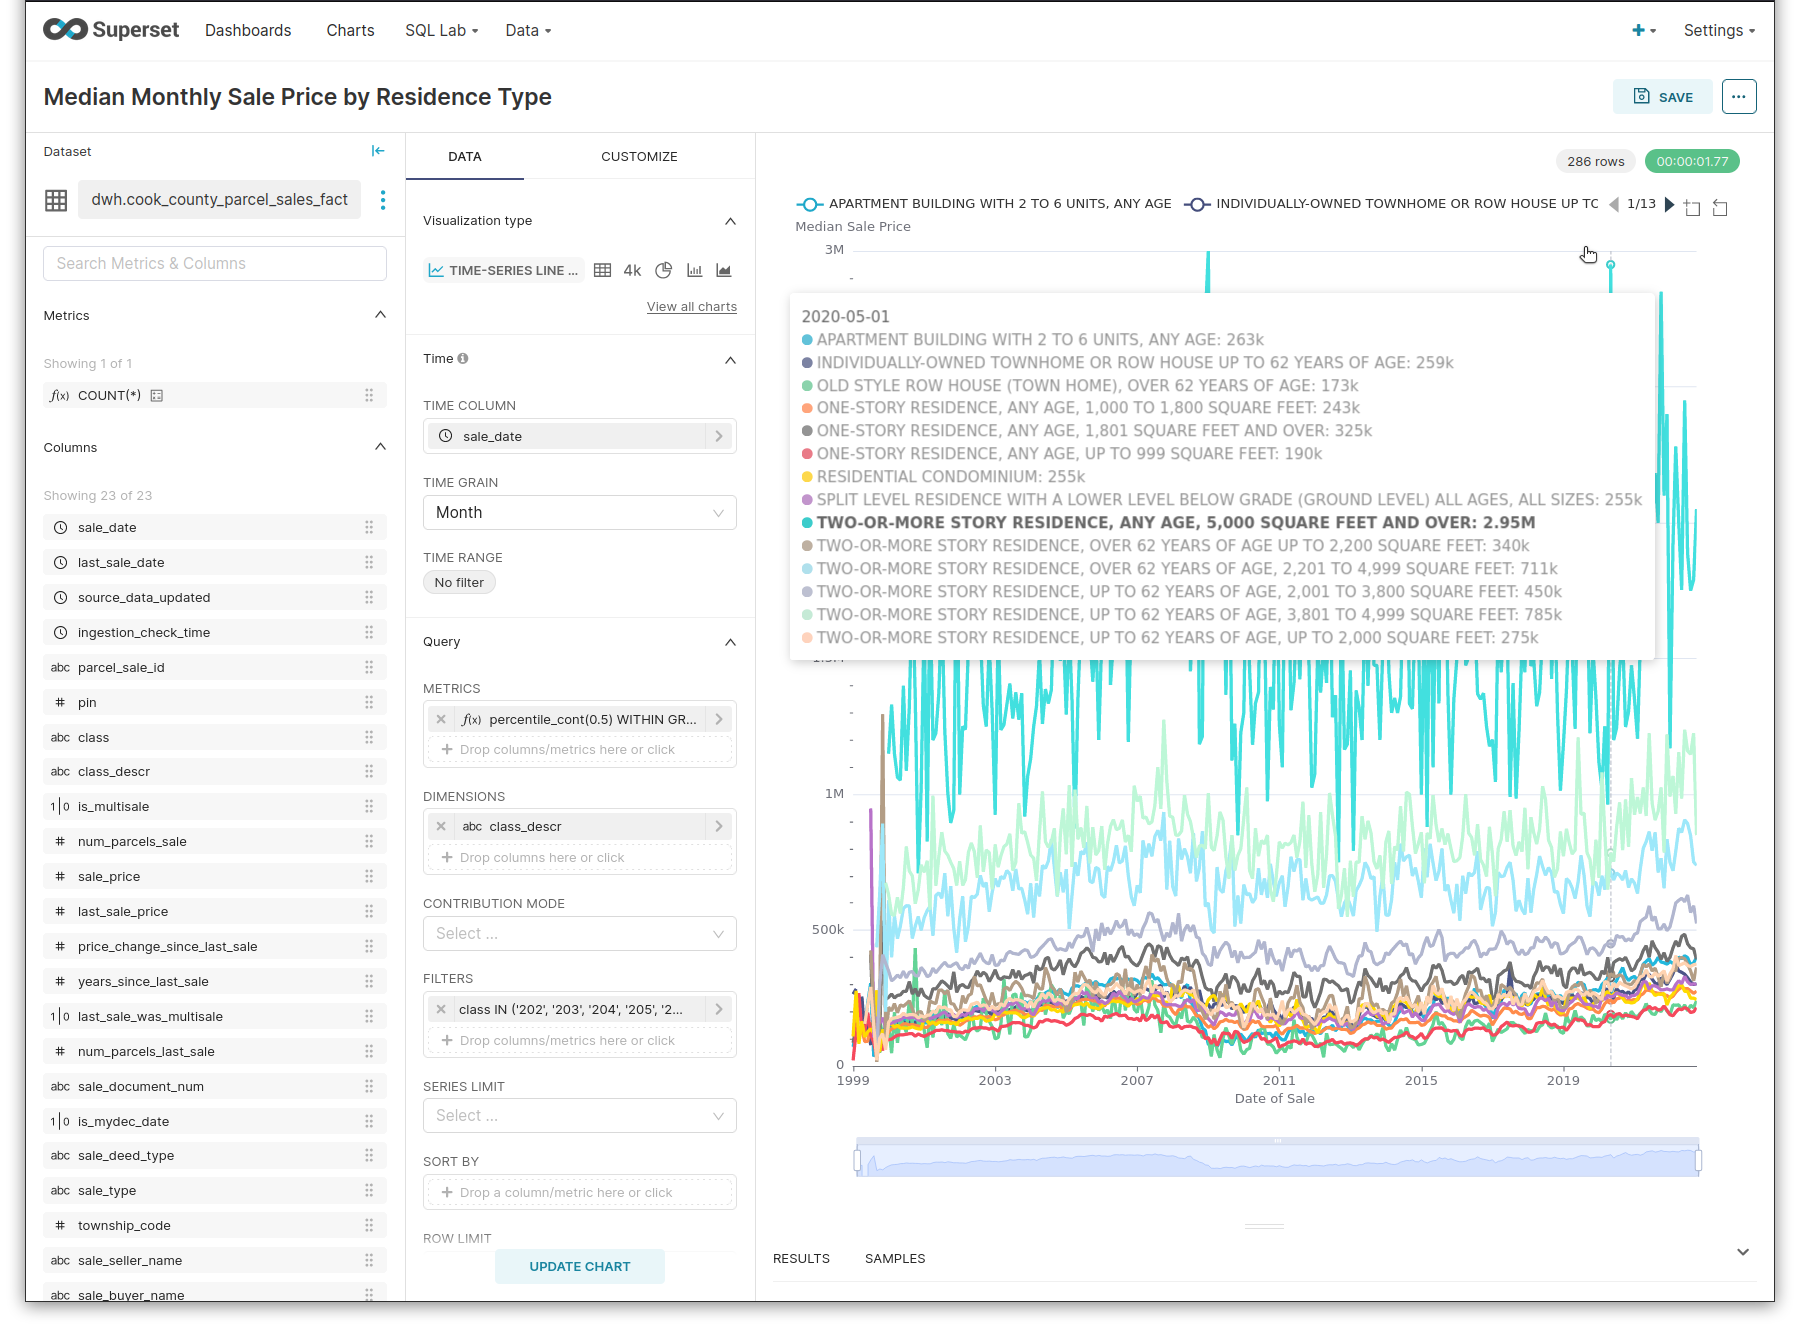
Apache Superset for:
- Interactive Data Visualization and EDA
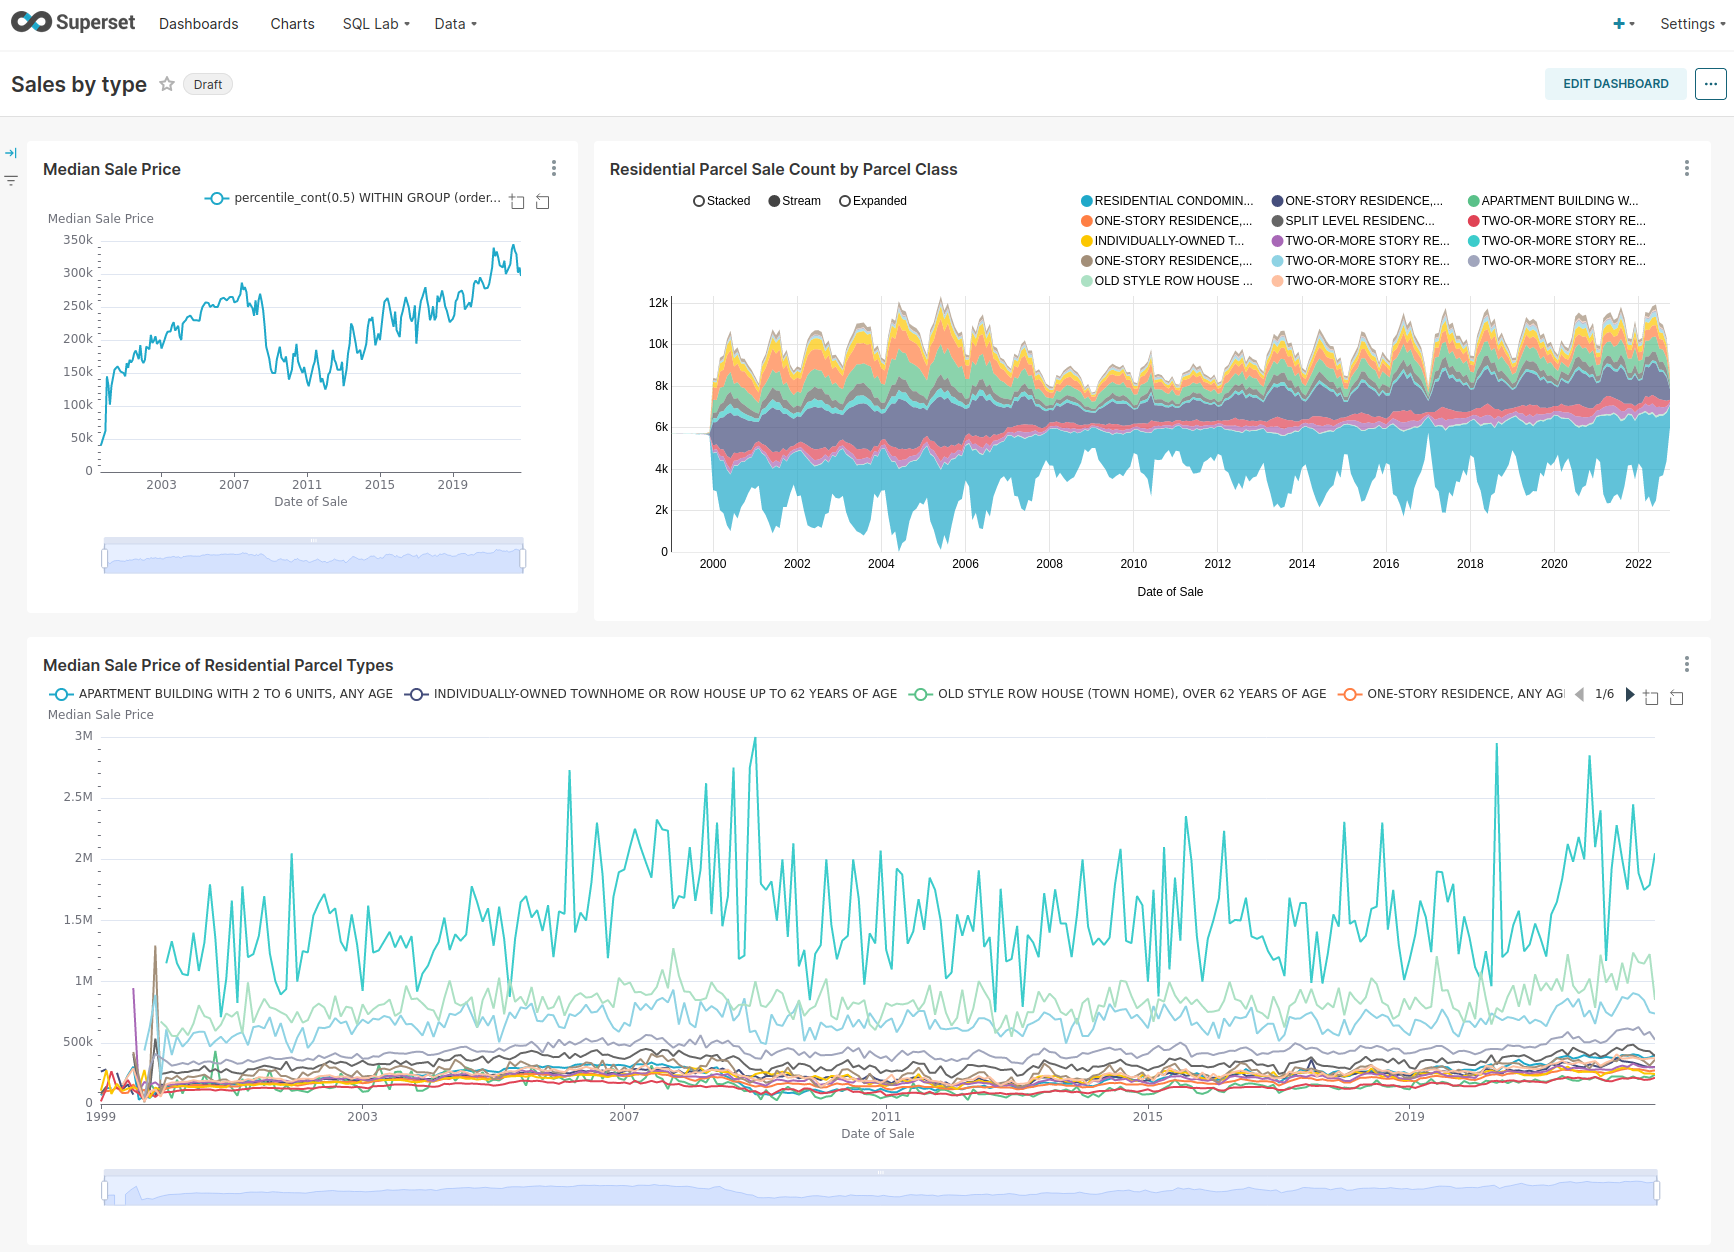
- Dashboarding and Reporting
-
a pgAdmin4 database administration interface,
-
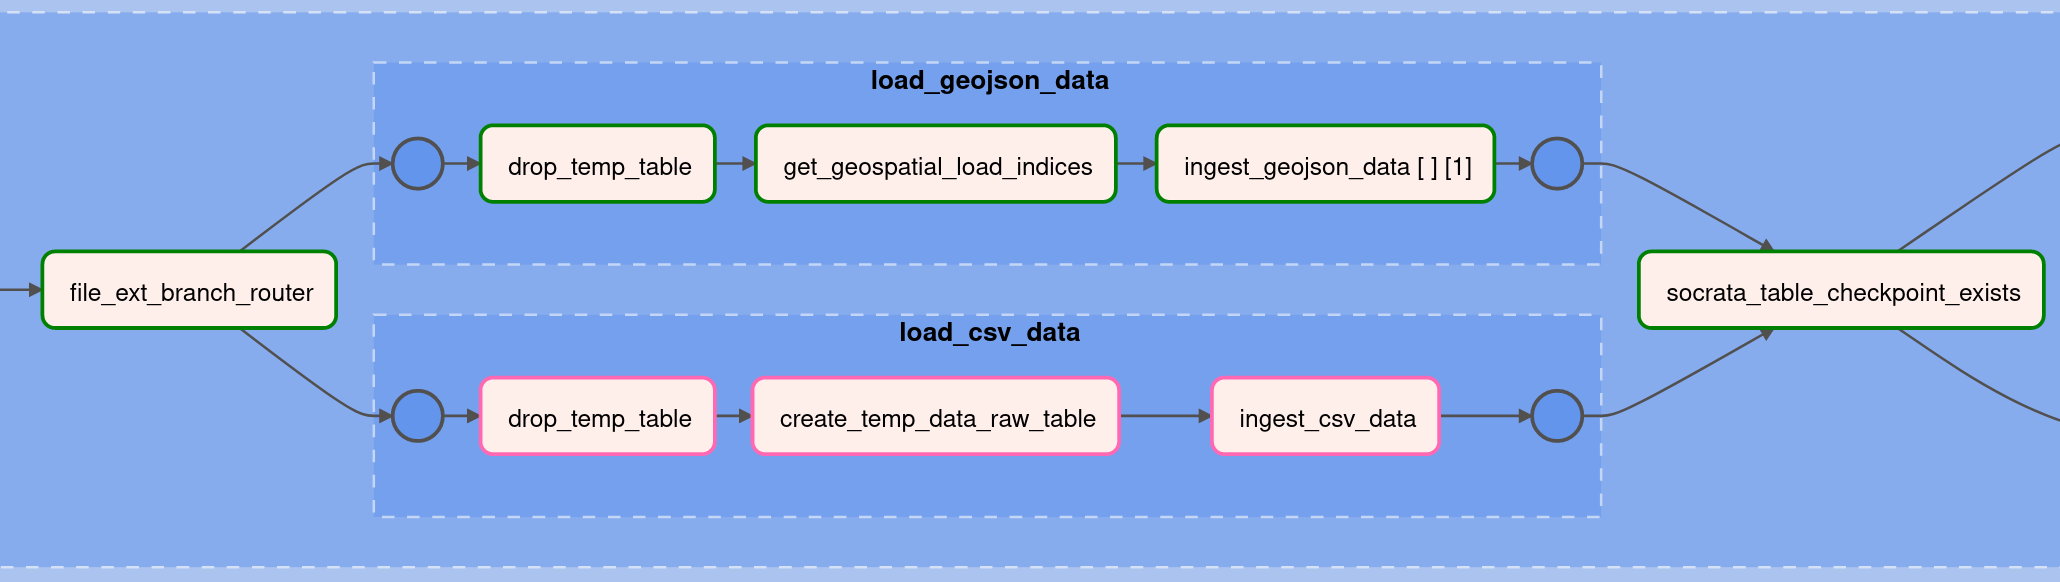
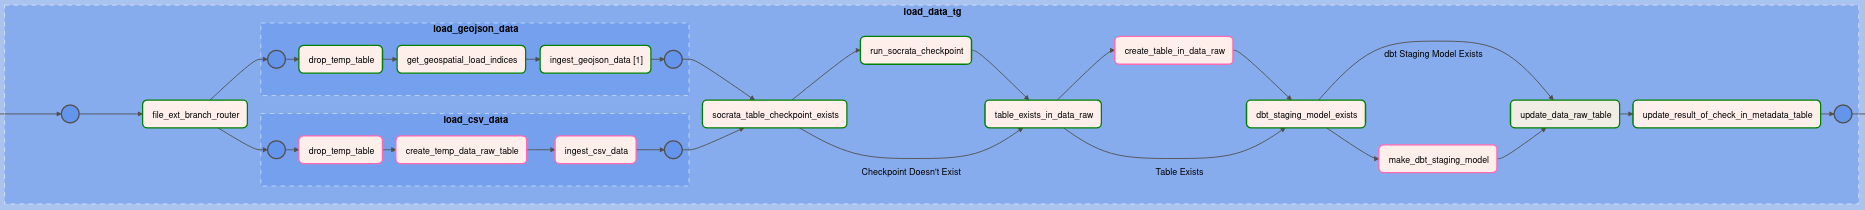
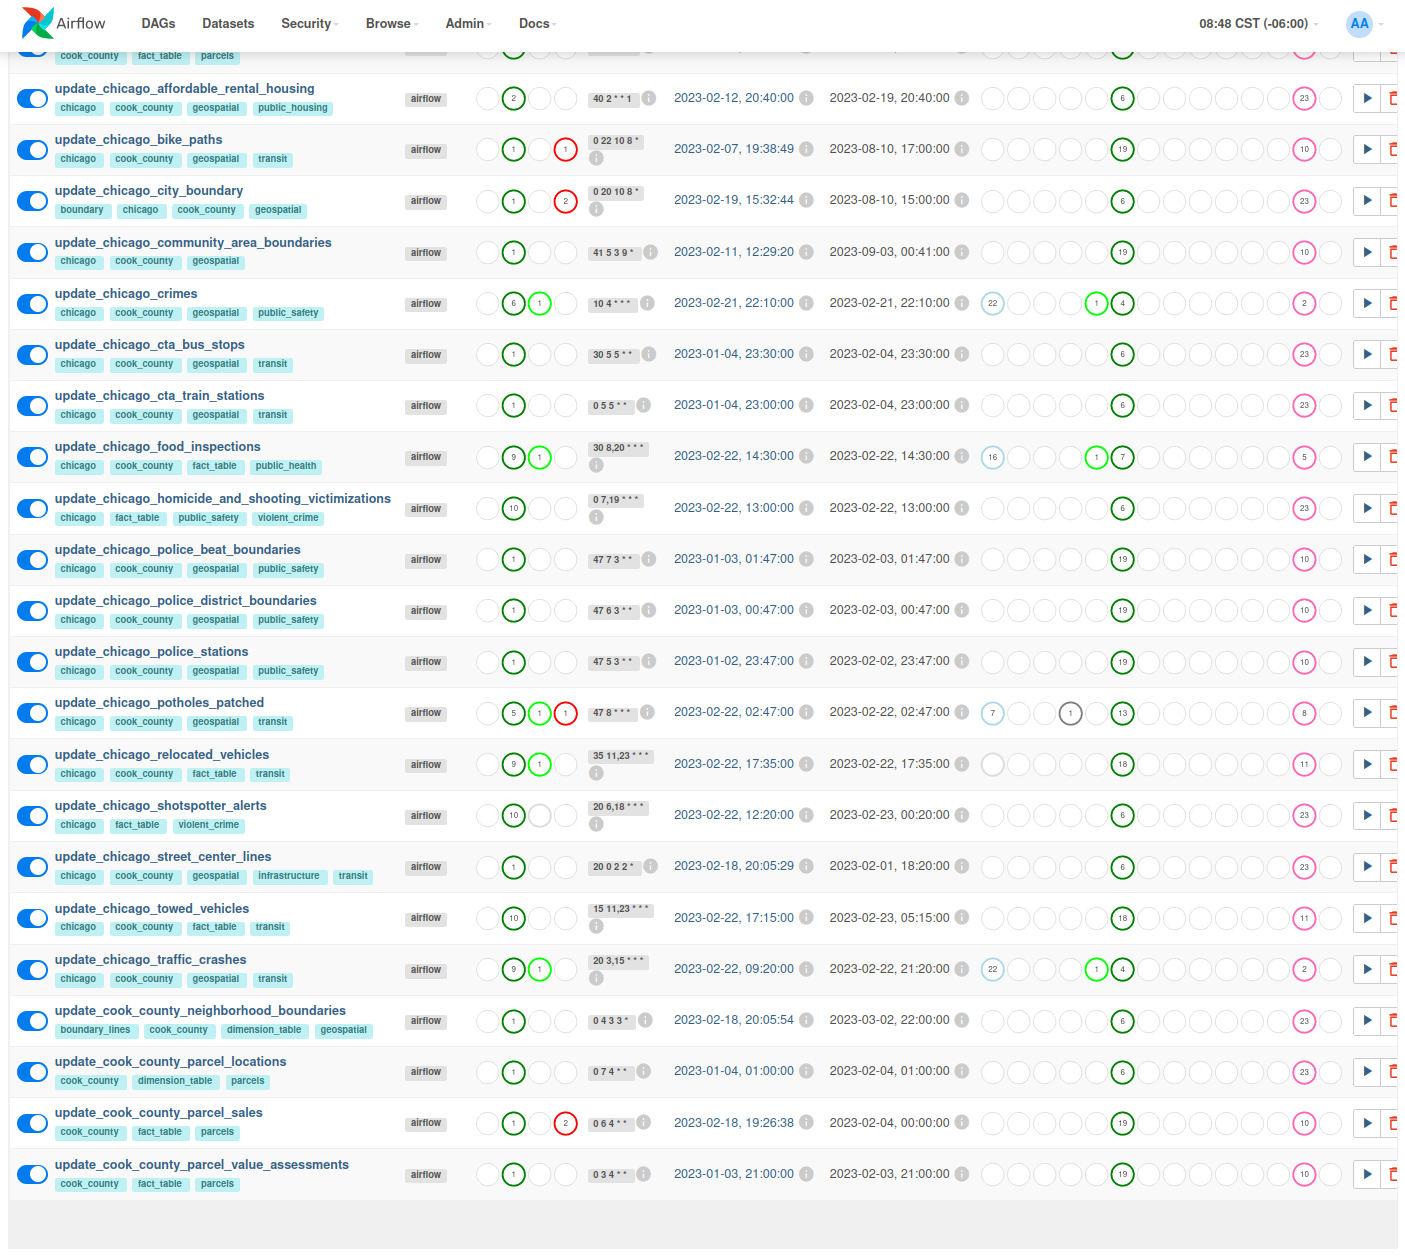
Airflow components to orchestrate execution of tasks,
-
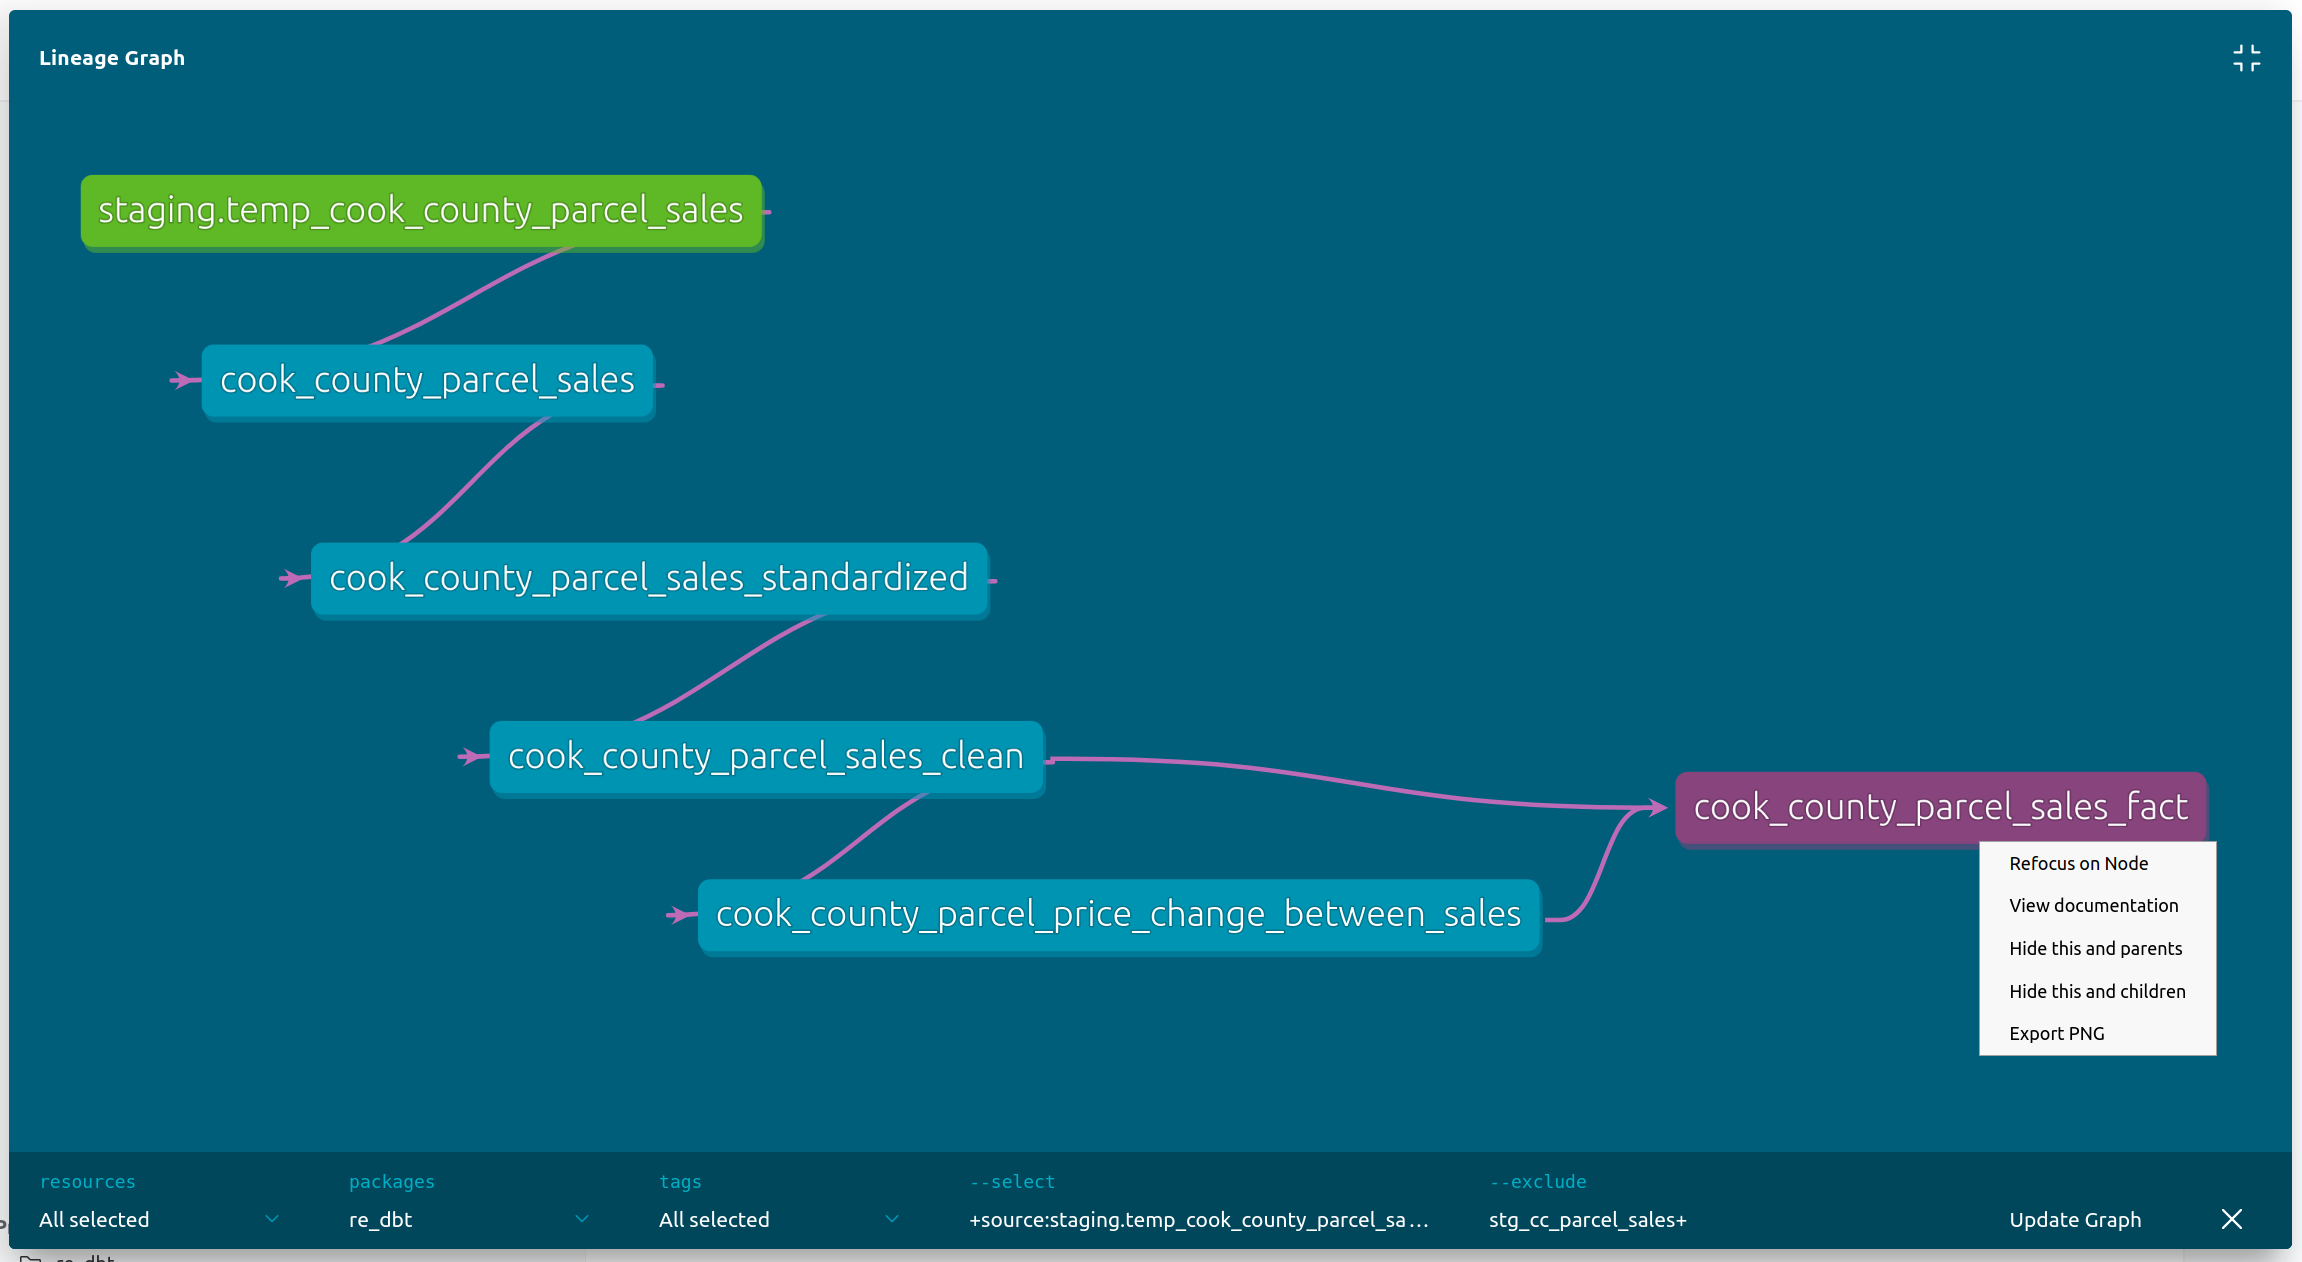
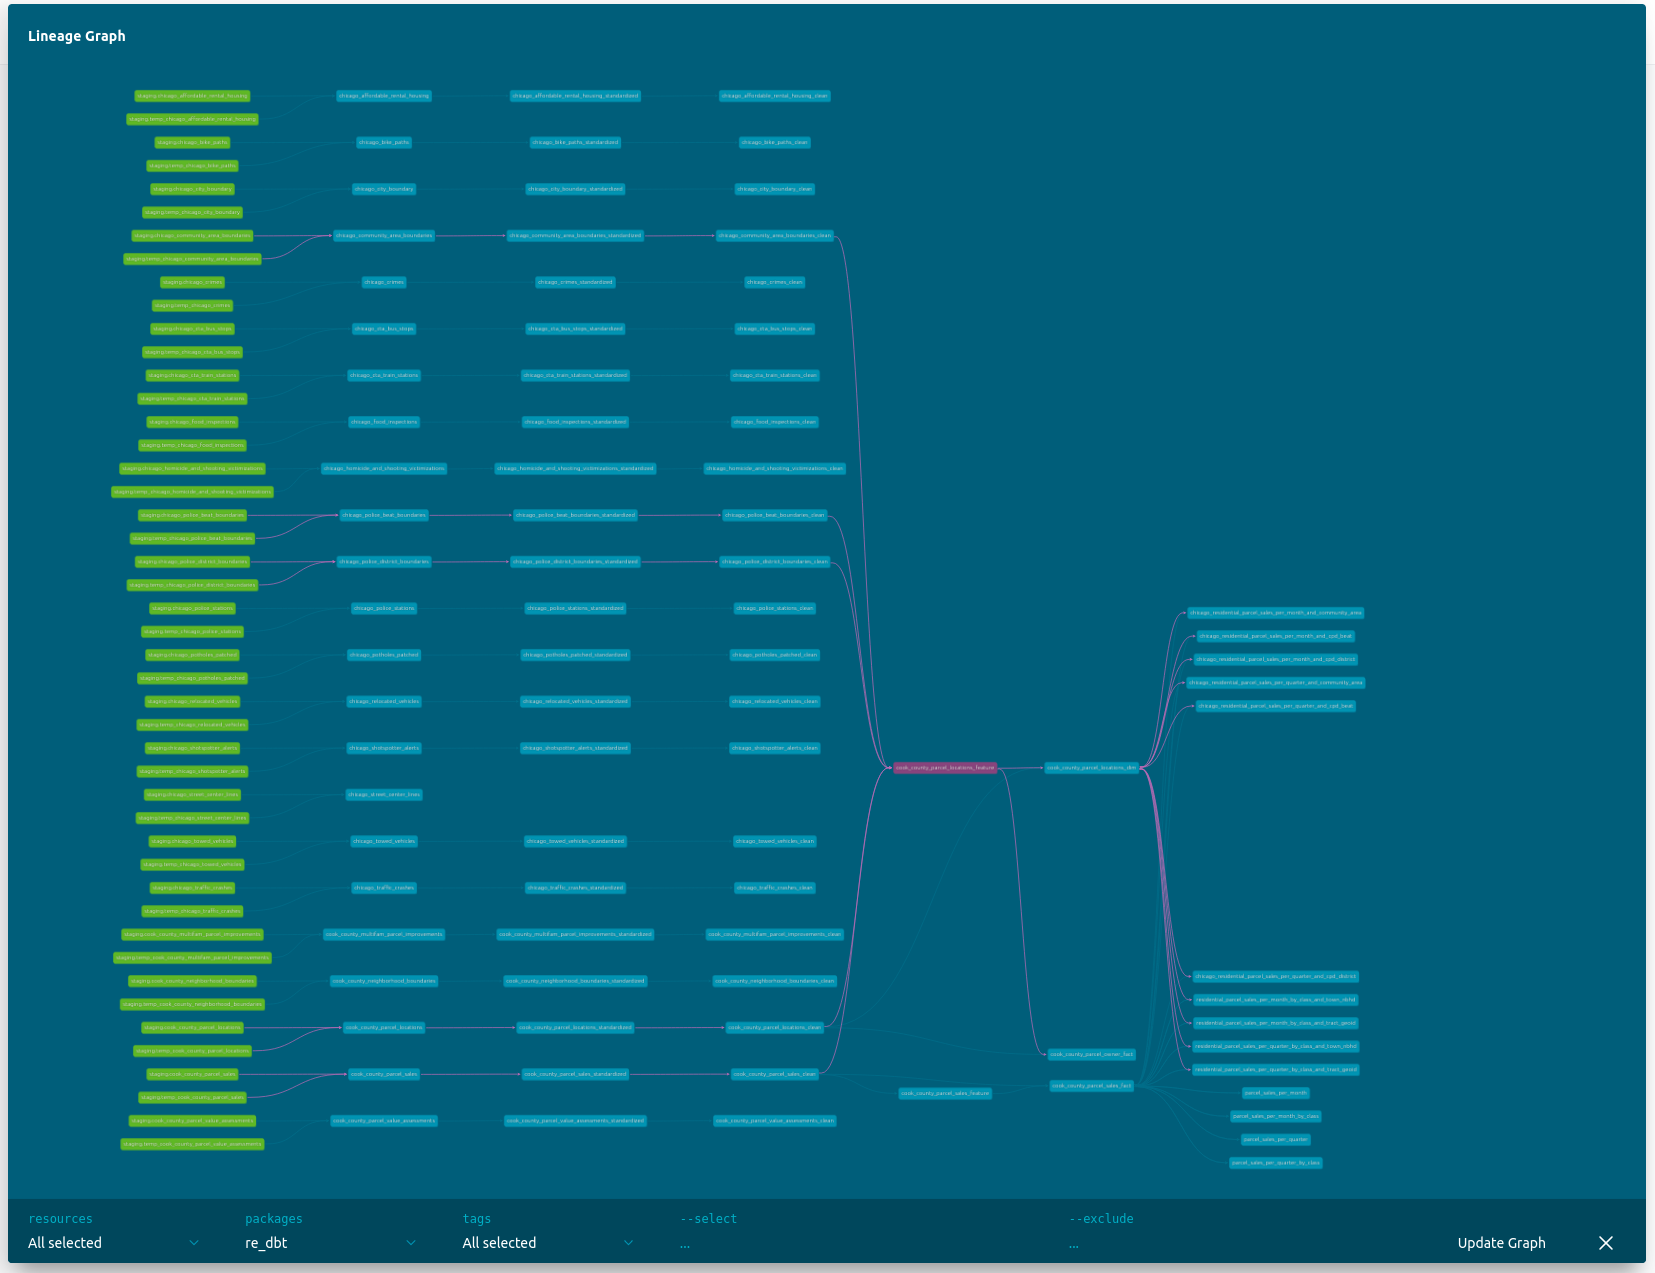
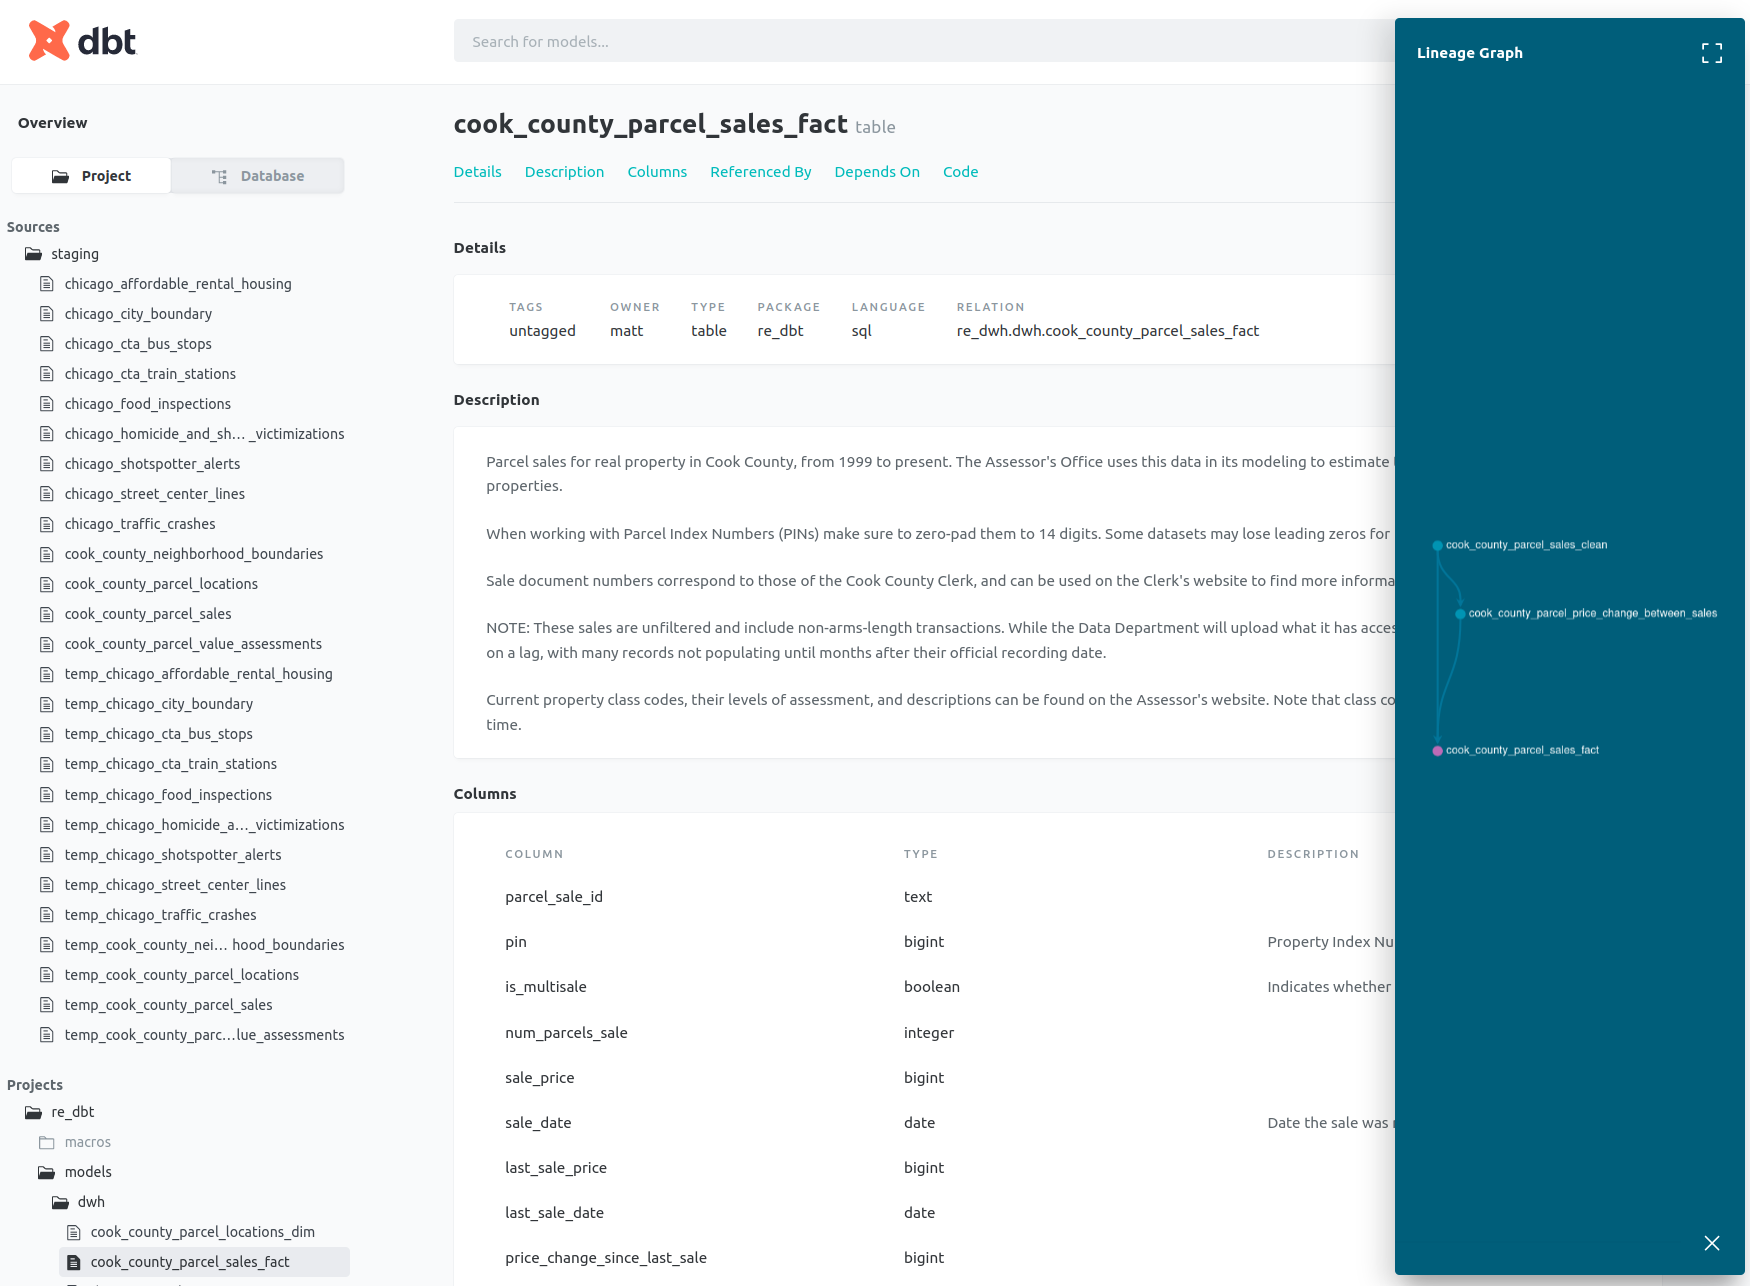
dbt to:
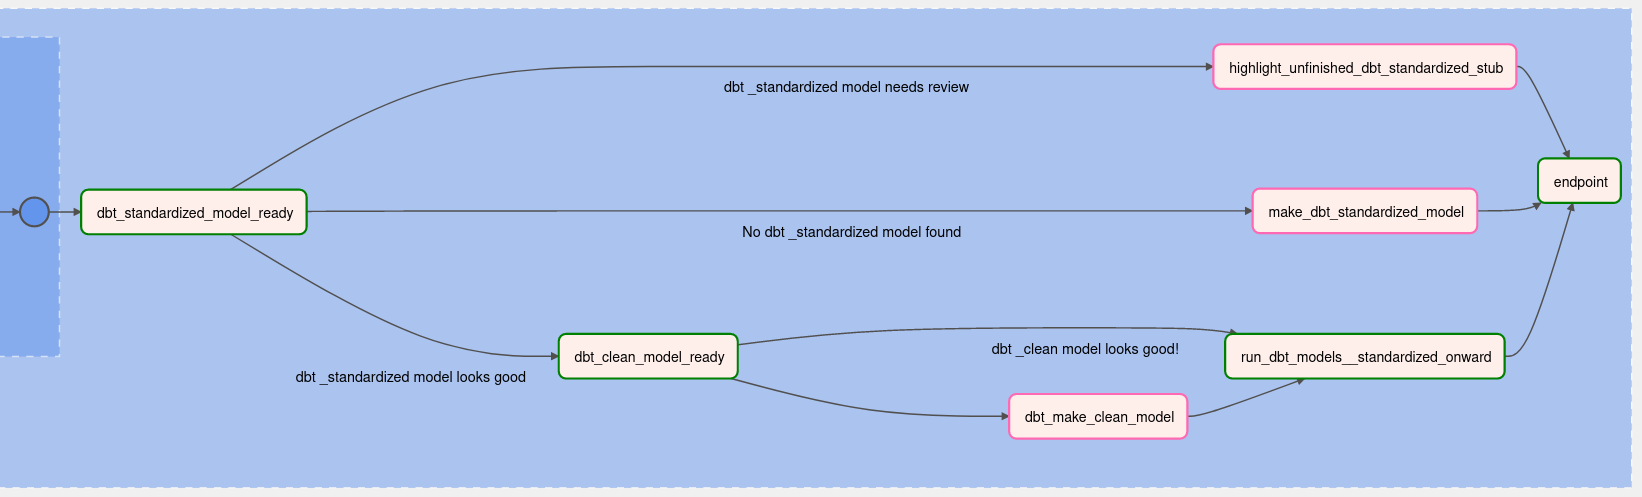
- manage sequential data transformation + cleaning tasks,
- serve data documentation and data lineage graphs, and
- facilitate search of the data dictionary and data catalog
-
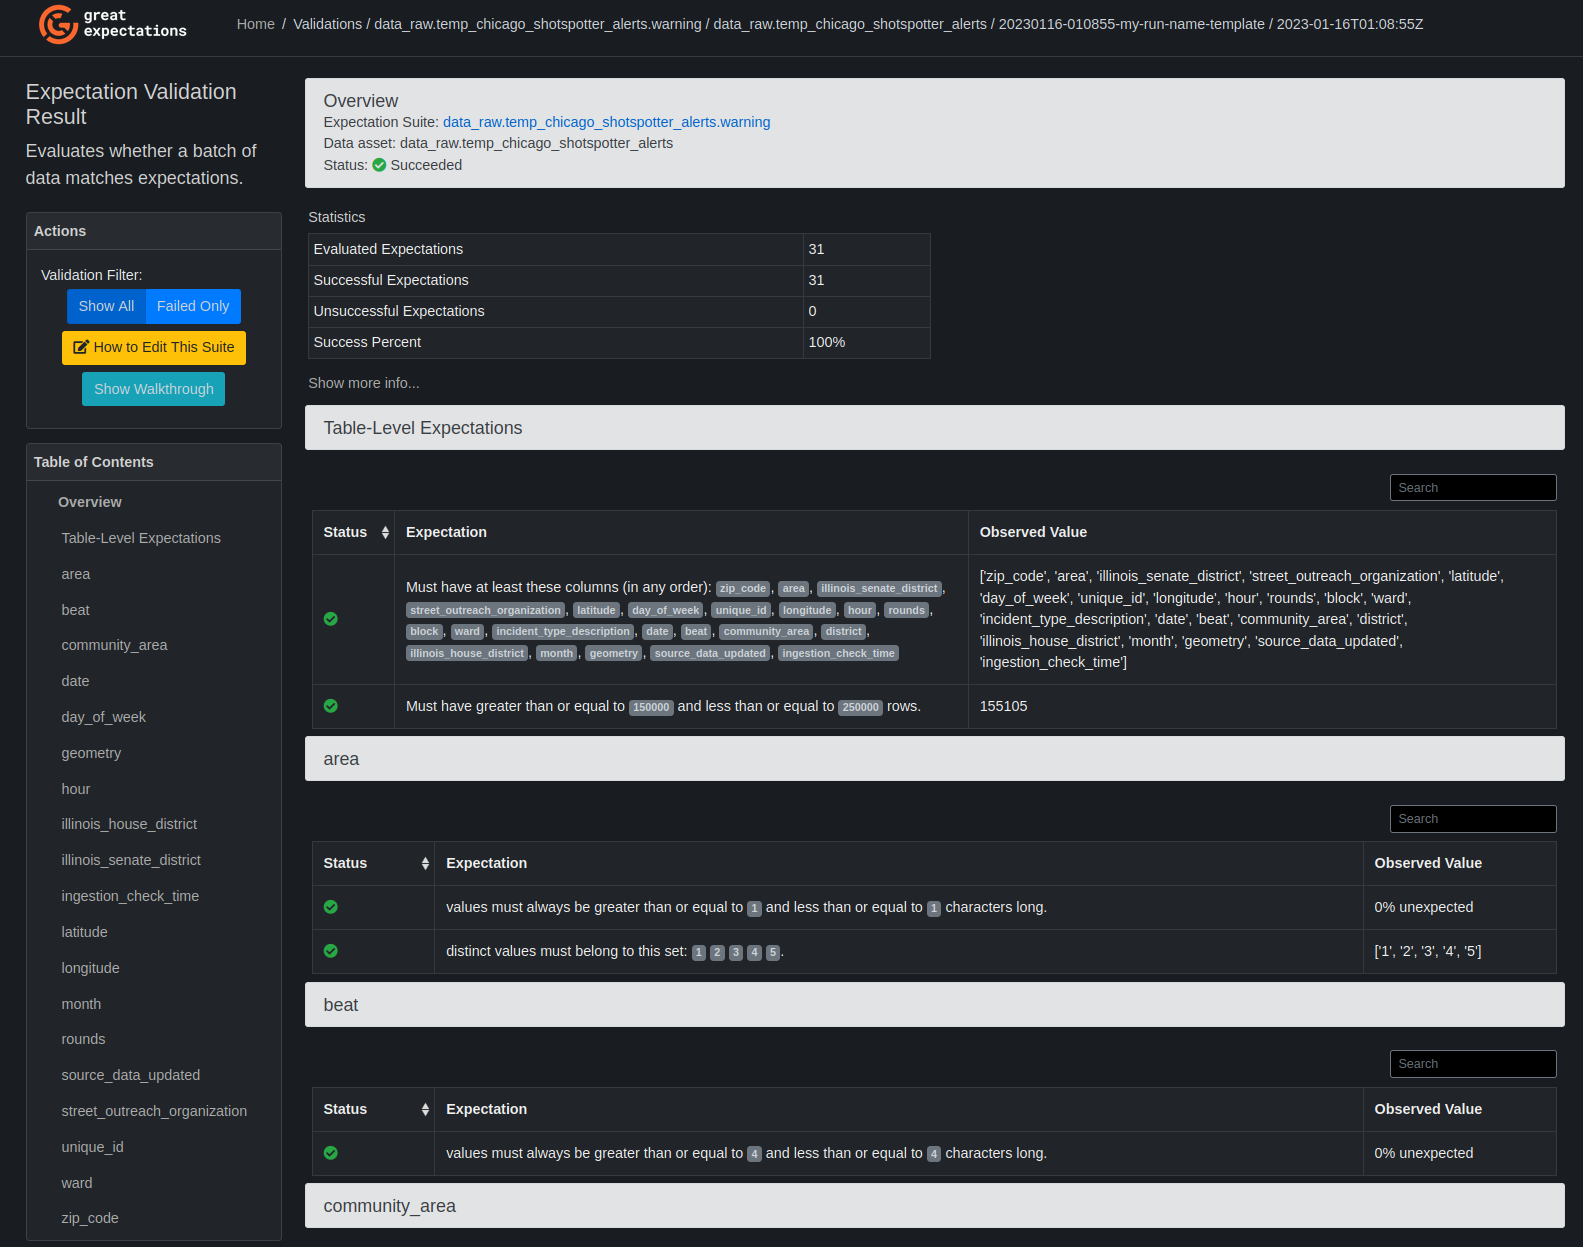
great_expectations for anomaly detection and data monitoring, and
-
custom python code that makes it easy to implement an ELT pipeline for any other table hosted by Socrata